Mastering Statistical Process Control Charts in Healthcare - online book
Announcing the early development book by Jacob Anhøj & Mohammed Amin Mohammed
Jacob and Mohammed are well known in the NHS-R Community for both their contributions to the community in R but also for SPC. They’ve combined their deep knowledge of SPC, particularly in relation to healthcare, with this online book.
It’s in an early draft practical, hands-on, step-by-step guide is designed specifically for data scientists using R in healthcare settings and both authors would love to hear from you! Whether you're an SPC expert or just starting, your thoughts, challenges, and innovative use cases could make it into the book (with a special acknowledgment, of course).
Input can be on GitHub (https://github.com/anhoej/spc4hc) or via email or DM us on NHS-R Community’s Slack:
Jacob Anhøj: jacob@anhoej.net
Mohammed A. Mohammed: m.mohammed2@nhs.net
Your engagement will help shape this resource for the healthcare data science community!
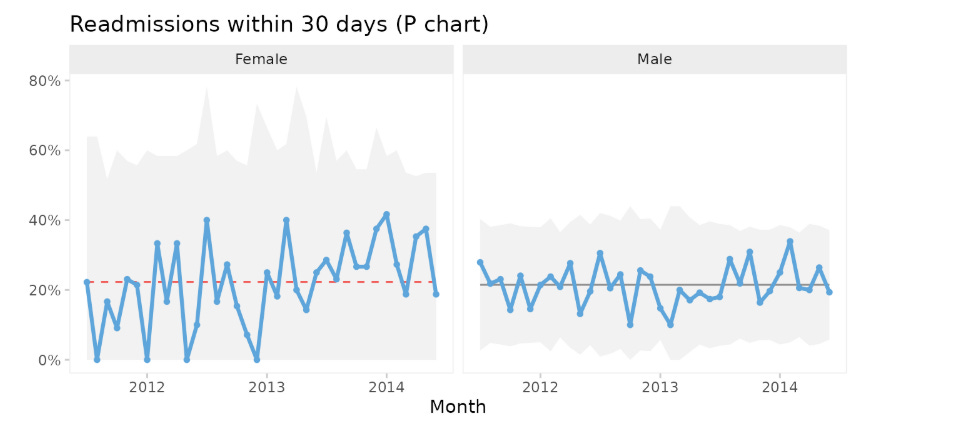
Jacob is the author of qicharts2 which can be used to produce many SPC charts including: I, MR, Xbar, S, T, C, U, U’, P, P’, and G charts as well as run charts and Pareto.
Jacob also kindly hosted a workshop for Statistical Process control charts with R where you can learn the tools, most notably the process control chart, which is a simple an elegant graph that helps to distinguish between common and special cause variation in processes in time or space.


